Appended Note 2-3 Determinants of Dividend Expansion
- Japanese
- English
1. Outline
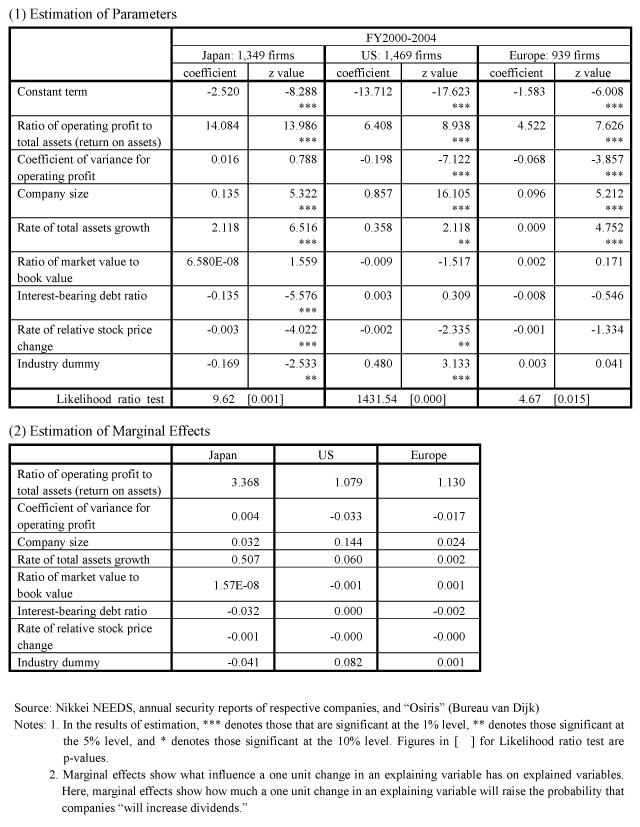
Analyses are made based on panel data of companies listed in the First Section of the Tokyo Stock Exchange to clarify how companies' decision making concerning dividend policies is affected by their financial features and share prices.
In international comparison with the US and European countries, panel data of listed companies in the US and the EU (15 former EU countries) is used.
2. Data
Based on Nikkei NEEDS, annual security reports of respective companies, and "Osiris" (Bureau van Dijk), consolidated financial statements of listed companies are used. For financial data, figures for five years (FY2000-FY2004) are used. However, for panel data, data for four years are used, because year-on-year change is used as an explaining variable in some parts.
3. Estimation Method
For this estimation, an explained variable is discrete choice between "increased dividends (= 1)" and "didn't change or decreased dividends (= 0)", and binary logit model is selected.
Assuming a benefit when company i chose to increase dividends as Ui, it is supposed that ui, a part among Ui that is observable with an explaining variable, can be expressed by the following linear function.

| OP/A : | Ratio of operating profit to total assets (= Operating profit / Total assets) |
| VAC : | Coefficient of variance for operating profit (= Standard deviation for 5 years / Average absolute value) |
| AST : | Company size (= using Logarithmic value of the total assets) |
| GROW : | Rate of total assets growth |
| MC/C : | Ratio of market value to book value (= using Current aggregate value of shares / Equity capital) |
| DWI/C : | Interest-bearing debt ratio (= Total of interest-bearing debts / Equity capital) |
| STK : | Rate of relative stock price change (= Percentage change of relevant company's share prices - Percentage change of major stock index) |
| D : | Industry dummy (= Non-manufacturing = 0, Manufacturing = 1) |
Under such settings, assuming that probabilistic parts that cannot be explained by u is independently distributed logistically, and each company's selection is mutually independent, parameters are estimated to maximize logarithm likelihood.
(1) For coefficient of variance for operating profit, figures calculated by respective companies based on accounting data for five years (FY2000-FY2004) are used, and the same company has the same parameter for five years.
(2) For calculating relative stock price change, TOPIX, S&P500, and MSCI Europe Index are used as major stock index for Japan, the US, and Europe, respectively.
(3) Panel analysis is made based on the above-mentioned estimation model. A Random effect model is adopted as an estimation method.
4. Results of Analysis

