Appended Note 2-2 Business Investment and Fund-raising Constraints
- Japanese
- English
1. Outline
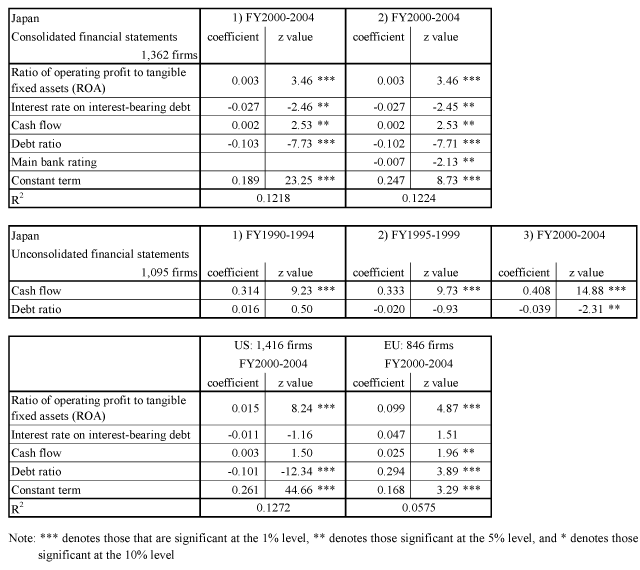
Analyses are made based on panel data of companies listed in the First Section of the Tokyo Stock Exchange to clarify how companies' business investment is affected by cash flows (internal funds) and financial environment of external funds. In international comparison with the US and European countries, panel data of listed companies in the US and the EU (15 former EU countries) is used.
2. Data
Nikkei NEEDS; Corporate Financial Databank, Japan Economic Research Institute and Development Bank of Japan; "Osiris," Bureau van Dijk; National Accounts, Cabinet Office; Corporate Goods Price Index, Bank of Japan; Bloomberg; Kaisha Shikiho (Corporate Quarterly Handbook) and Yakuin Shikiho (Corporate Executives Quarterly Handbook), TOYO KEIZAI INC.
3. Estimation Method

I/K: Business investment / Tangible fixed assets ROA: Operating profit / Tangible fixed assets R: Interest cost and discount charge / Interest-bearing debts (Long-term and short-term borrowings, Corporate bonds) CASH/K: (Consolidated) Operating cash flows / Tangible fixed assets (Unconsolidated) (Current profit x (1 - Effective tax rate) + Depreciation cost) / Tangible fixed assets Effective tax rate was 49.98% in and before FY1997, 46.36% in FY1998, 40.87% in and after FY1999, and 39.54% in FY2004. DEBT: Debt / Total assets MB: Rating of main financing banks |
(1) Business investment is made real by business investment deflator, operating profit and operating cash flows by GDP deflator, and interest cost by domestic corporate goods price.
(2) Estimation period and target companies
Japan Consolidated financial statements: FY2000-2004, 1,362 companies
Japan Unconsolidated financial statements: FY 1990-2004, 1,095 companies
The US Consolidated financial statements: FY 2000-2004, 1,416 companies
Europe Consolidated financial statements: FY 2000-2004, 846 companies
(3) Main financing banks are judged based on debt balance, ratio of shareholding, and composition of executives, etc., and the rating by Standard & Poor's as of FY2000 is used.
(4) Panel analysis is made based on the above-mentioned estimation model. A Random effect model is adopted as an estimation method.
4. Results of Analysis

