Appended Note 3-14 Analysis of individual data from research on corporate technology creation
- Japanese
- English
1. Analysis of technology management and innovation (Chart 3-4-7 (1), (2))
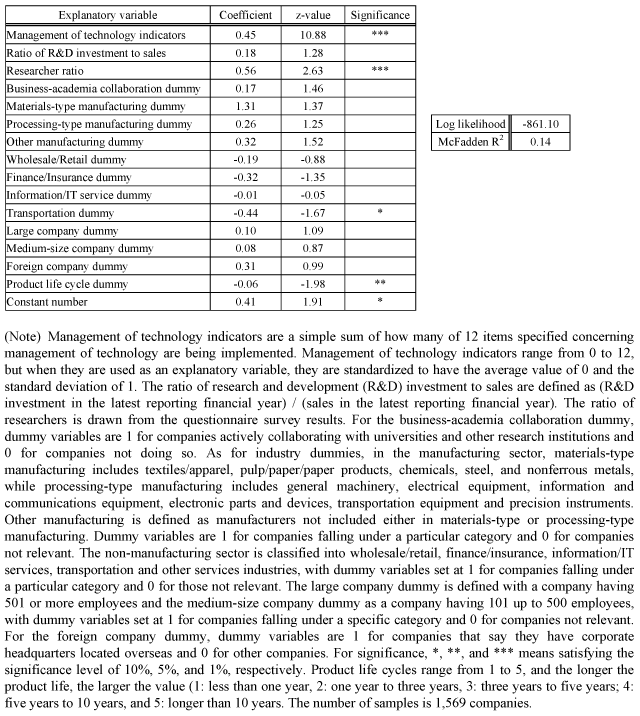
(1) Probit model analysis of the innovation propensity (Chart 3-4-7 (1), (2) innovation propensity)
The innovation propensity was analyzed using a probit model, with the existence or non-existence of innovation (realization=1, non-realization=0) as the explained variable. Coefficients of explanatory variables and their z-value are shown in the table below.
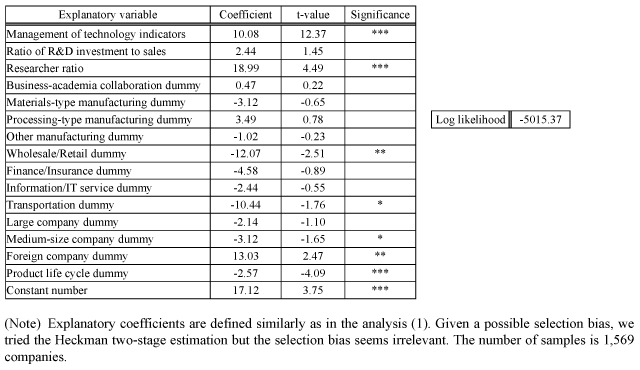
(2) Probit model analysis of the ratio of products and services developed through innovation to total sales (Chart 3-4-7 (2) innovation efficiency)
The innovation efficiency was analyzed using a probit model, with the ratio of products and services traced to innovation to total sales as the explained variable (percentages ranging from 0 to 100). Coefficients of explanatory variables and their t-value are shown in the table below.
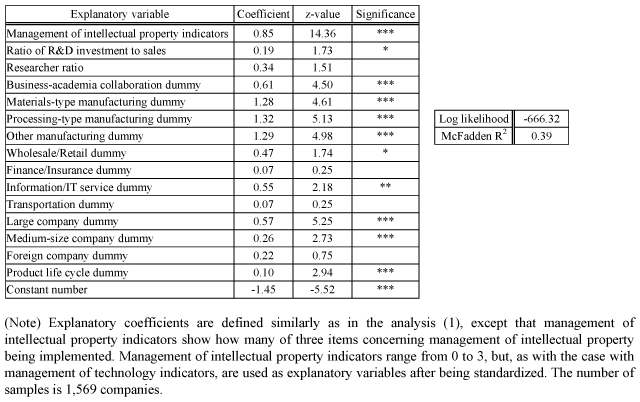
(3) Probit model analysis of the existence or non-existence of patents for the protection of products and services developed through innovation (Chart 3-4-7 (2) patent holding propensity)
The patent holding propensity was analyzed using a probit model, with the existence or non-existence of patents for the protection of products and services developed through innovation as the explained variable (holding = 1, non-holding = 0). Coefficients of explanatory variables and their z-value are shown in the table below.
(4) Probit model analysis of the ratio of sales protected by patents (Chart 3-4-7 (2) patent efficiency)
The patent efficiency was analyzed using a probit model, with the ratio of sales protected by patents as the explained variable (percentages ranging from 0 to 100). Coefficients of explanatory variables and their t-value are shown in the table below.
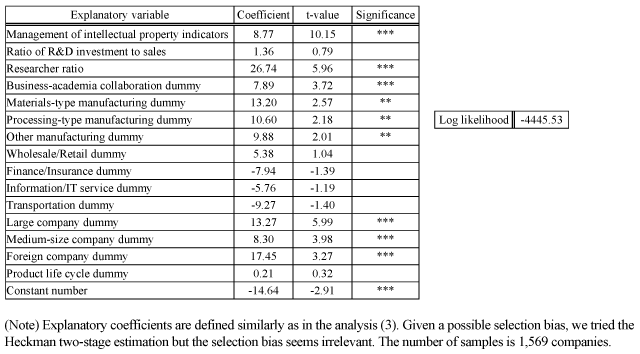
2. Levels of management of technology indicators and researcher ratios and the productivity of labor (Chart 3-4-8)
After matching the questionnaire survey results and financial data, a regression analysis was conducted with the productivity of labor (natural logarithm) as the explained variable. Coefficients of explanatory variables and t-value are shown in the following table.
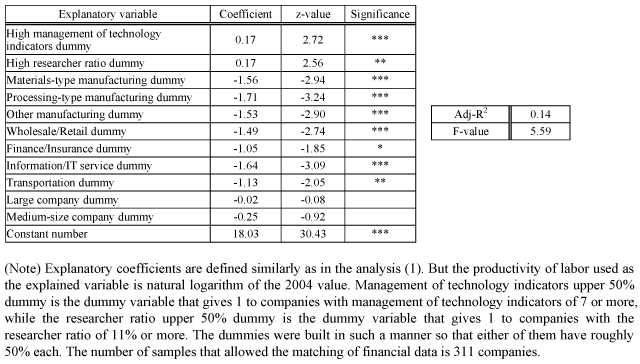
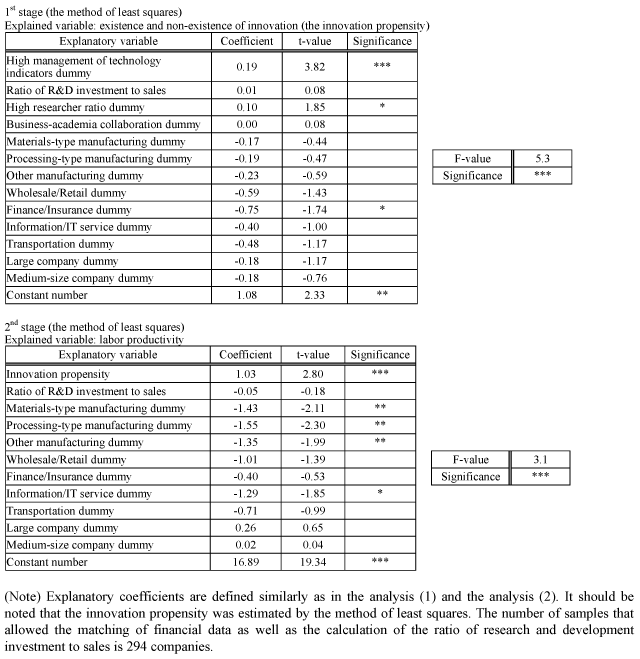
3. Contribution of innovation to the productivity of labor (estimation with the instrumental variable method)
After matching the questionnaire survey results and financial data, a regression analysis was conducted with the productivity of labor as the explained variable with the instrumental variable method. The existence and non-existence of innovation (the innovation propensity) was operated by the instrumental variable. The results of the regression analysis are shown in the table below.
