Appended Note 3-2 Divisia Labor Index
- Japanese
- English
The Divisia Labor Index is one of indexes of labor force that takes the quality of labor into account. Under the assumption that the labor market is perfect, the index is calculated by presuming that wages actually paid reflect differences of the quality (productivity) of workers by employment attribute. The labor index is simply calculated from total wages paid by multiplying amounts of wages by the number of workers. In showing time-series changes, however, the index is calculated by adopting continuous (Divisia index) benchmarks for wages and worker numbers which are said to have smaller biases than the Laspeyres index or the Paasche index.
1. Estimation method for the Divisia Labor Index
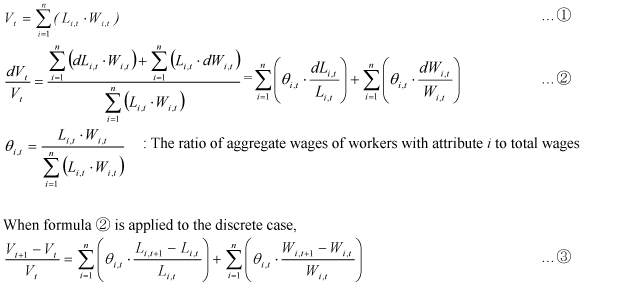
The generalized estimation method is shown below. Workers are classified by attribute into n types, and the number of workers for each type at the time t is shown as Ln,t, and per-capita wages by attribute as Wn,t. Then, total wages Vt are expressed with formula  as below, and the rate of growth of total wages with formula
  .
.  i,t in formula
  shows the ratio of aggregate wages for workers with attribute i to total wages.

To focus attention on changes in the composition of workers, we disregard the second term of the right-hand side of formula  , which indicates changes in wages of workers with the same attribute. Thus, this would eliminate the impact of price changes. The actual estimation was made by setting the weight at the average
  i,t of the two bordering periods and using formula
  which uses approximate value by logarithm.

The index was formed from the growth rate of Vt obtained from formula  , with the base of 100 for 1985. As this index includes a factor from increases in the number of workers, another index was formed to show the quality of workers by dividing the first index by the number of workers.
Using the "Basic Survey on Wage Structure" of the Ministry of Health, Labour and Welfare, the estimation was made by classifying workers by sex (two categories), educational backgrounds (four categories), length of service (nine categories), age group (12 categories) for a total of 864 categories. The estimation period was from 1985 through 2003.
2. Contribution of each attribute to changes in the quality of labor
By making the same estimation by using only one classification of workers, instead of four as above, we can obtain the contribution of changes in the composition of workers by each attribute to the quality of labor. However, it should be noted that the estimation was made with the assumption that each attribute is independent from each other. For example, in estimating the contribution of the length of service to the quality of labor, it was assumed that all attributes other then the length of service were constant.
