Appended Note 1-3 Calculation method of GDP gaps
- Japanese
- English
1. Calculation Method
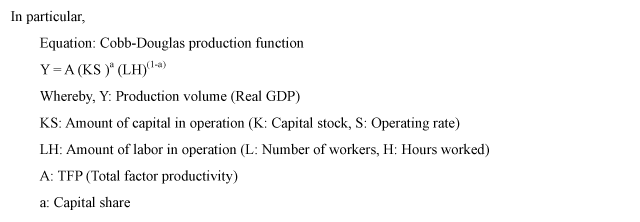
GDP gaps are defined as: (Actual GDP - Potential GDP)/Potential GDP. The estimation of potential GDP is essential for the calculation of GDP gaps. Potential GDP is estimated by determining the production function and:
(1) Calculating the portion of the real growth rate while excluding capital and labor (Solow Residual) and estimating the total factor productivity;
(2) Adding the total factor productivity estimated in (1) to the amount contributed to by the potential capital and labor.

lnA is derived by dividing both sides by LH and substituting 0.33 as a in the following logarithmically transformed equation. The value which has been smoothed by the Hodrick-Prescott (HP) filter is used as the TFP.

The capital share (0.33) is taken from the average value since 1980 derived from the equation: 1-employee's compensation/(depreciation of fixed capital + operating surplus + employee compensation - household operating surplus).
2. Specific variables
(1) Capital input
| Actual input: | The sum of the capital stock of the private manufacturing industries (installation based, value from the end of the previous term) to the power of the operation rate of the manufacturing industries and the capital stock of the private non-manufacturing industries (same as above) to the power of the operation rate of the non-manufacturing industries. The operation rate of the private non-manufacturing industries is estimated by excluding the trend from the ratio, "Indexes of Tertiary Industry Activity / capital stock of non-manufacturing industries." As for the capital stock of private companies, the capital stock since 1994 was newly derived with the following method since the chain-linking method was not introduced in its realization method. Firstly, the capital investment of private companies of the chain-linked QE was accumulated while using the capital stock of private companies in the first quarter of 1994 as a bench mark. The following formula was used for the estimation. |
| Capital stock of private companies (after the second quarter of 1994, estimated value) (new) = (K of the first quarter of 1994 (old) + accumulation of investment (new) x the deviation rate
|
|
| Furthermore, the capital stock prior to 1993 is linked to the 68SNA. Gaps were adjusted with regard to the privatization of NTT and JR as well as the sellout of shinkansen to the private sector. |
|
| Potential input: | While using the operation rate of manufacturing and non-manufacturing industries as dependent variable, the potential input was derived by regressing both of these variables with the "Production Capacity DI" in the Short-term Economic Survey of Enterprises in Japan (TANKAN Survey) of the Bank of Japan while using the potential operation rate which excludes all factors of economic conditions. |
(2) Hours worked
| Real input: | Total hours worked = the sum of scheduled hours worked + nonscheduled hours worked (data from offices with more than 30 employees) |
| Potential input: | The total real hours worked modified through the HP filter is used as the potential hours worked. |
(3) Number of workers
| Real input: | number of workers |
| Potential input: | (Population aged 15 and above x trend labor participation rate) x (1 - structural unemployment rate). The labor participation rate modified through the HP filter is used as the trend labor participation rate. The structural unemployment rate is estimated from the relationship between the unemployment rate and the vacancy rate. |
3. Estimation results
It must be noted that the estimation results of potential growth rate varies with the calculation method being used and which factor(s) will be used as potential inputs. However, the estimated potential growth rate is moving as shown below. The amount of contribution from the total factor productivity (TFP) is increasing after reaching its bottom in 1997.

The series of chaining formula was used to estimate potential GDP growth rate. However, compendium method has been used temporarily for the estimation as there are no capital stock based on a chaining formula. As such, it must be noted that there is a possibility that the above results may differ from the estimated results using new capital stock that may be announced in the future.
4. Sources:
| Real GDP: | Annual Report on National Accounts, Cabinet Office |
| Capital stock: | Private Sector Capital Stock Statistics, Cabinet Office |
| Operation rate: | Production, Shipments, Inventory and Indexes of Tertiary Industry Activity Index, Ministry of Economy, Trade and Industry; Short-term Economic Survey of Enterprises in Japan (TANKAN Survey), Bank of Japan |
| Number of workers: | Labour Force Survey, Ministry of Internal Affairs and Communications |
| Hours worked: | Monthly Labor Survey, Ministry of Labour, Health and Welfare |
