Appended Note 3-8 Gap in Wages by Industry
- Japanese
- English
1. Summary
In general, gaps in wages of original figures in major statistics do not simply represent the excess profits (rent) that vary by industry because they are affected by the employees' age, gender, academic background, etc. Here, in accordance with Kosai, Suzuki, Ito (1998), gaps in wages that exclude such factors as age, gender, academic background and size of business establishments, representing pure wage premiums, were projected for 1985, 1990, 1995 and 2002.
2. Estimation method
For each of the 90 or so classifications separated into 24
profiles (2 gender x 4 academic background x 3 size of business offices) in
the Basic Survey on Wage Structure, an employee with characteristics representative
of each cell is assumed to exist. Taking each one of these cells as samples,
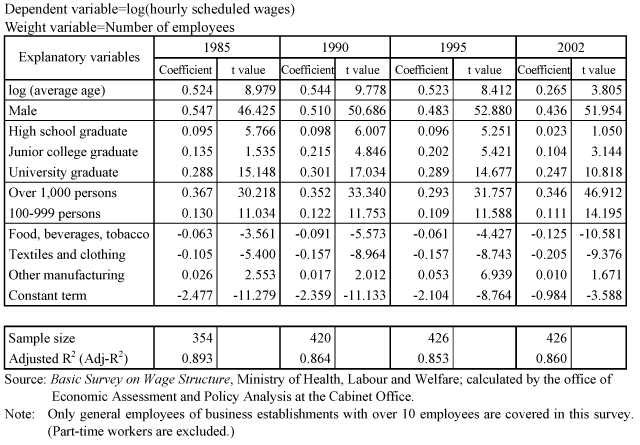
the following wage function is projected using regression analysis. The coefficient
 i of the industry dummy derived from the aforementioned projection
is considered to be the wage premium (expressed as a log).
 As the number of employees representing each cell varies,
the weighted least square method was used for the regression analysis with the
number of employees as the weight.
<Dataset>
From Basic Survey on Wage Structure, Ministry of Health, Labour and Welfare. Business establishments covered by this survey are those with over ten employees, and samples from which information pertaining to their industrial medium group classifications can be obtained are limited to general employees. (Civil servants, employees working in establishments with nine employees or less, and part-time workers are excluded.)
3. Estimation results

