Appended Note 3-7 Impact of Changes in Export-Import Ratio on Number of Employed Persons
- Japanese
- English
1. Summary
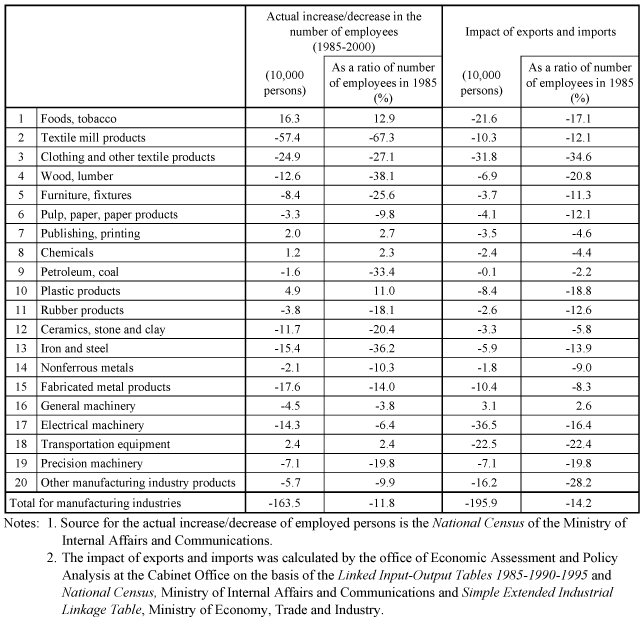
Based on Kosai, Suzuki, Ito (1998) and Sakurai (2002), the level of impact on the number of employees in the manufacturing industry by changes in export and import structure from 1985 to 2000 was estimated using the Input-Output Table. The basic idea of this analysis is to estimate the extent to which the number of employed persons increased or decreased given that the export-import ratio for 2000 is at the same level as it was in 1985. Here, the import (export) ratio = import (export) amount / (intermediate demand amount + domestic final demand amount).
2. Method of estimation
For this Input-Output Table analysis, the competitive import model, in which import is proportional to domestic demand (intermediate demand + domestic final demand), is used. The balanced equation for the production value is as follows.

The number of employed persons is expressed by the following formula.

1) Impact of changes in the import ratio
Firstly, by substituting the 1985 import ratio for the import coefficient m in the production amount balance equation (1) and substituting the figures in 2000 for the other variables, the domestic production value Xm1985 for 2000 assuming that the import ratio is at the same level as it was in 1985 is calculated. The difference between this amount and the actual production
amount in 2000 or X2000 ( Xm = X2000 -Xm1985)
is the changed portion of the domestic production amount resulting from changes
in the import ratio. Secondly, by assuming that labor productivity is not impacted
by import fluctuations, changes in the number of employed persons
  LM
due to changes in the import ratio can be calculated as
 Xm
using formula (2).
2) Impact of changes in the export ratio
The domestic production amount for 2000 when the export ratio
is at the same level as it was in 1985 can be estimated by calculating the export
amount for 2000 assuming that the level of export ratio is equal to that of
1985 and substituting that amount for E in formula (1). Changes in the number
of employed persons  LE due to changes in the export ratio can be
calculated in the same manner as 1).
3) Impact of changes in both the export and import ratios
 LM +
LM +  LE derived from 1) and 2)
represents changes in the number of employed persons due to changes in both
the export and import ratios.
<Input-Output Table>
Values for 1985 were derived from the Linked Input-Output Tables 1985-1990-1995, Ministry of Internal Affairs and Communications and values for 2000 were derived from Simple Extended Industrial Linkage Table, Ministry of Economy, Trade and Industry. All calculations were based on 1995 prices. Based on the White Paper on the Labour Economy (2003) of the Ministry of Health, Labour and Welfare, the number of employees for 2000 was calculated by the office of Economic Assessment and Policy Analysis at the Cabinet Office using the Linked Input-Output Tables 1985-1990-1995 and National Census, Ministry of Internal Affairs and Communications.
The number of the classified industries for conducting the Input-Output Table analysis was set at 62 including 43 manufacturing industries. In this estimate, results are shown for the 20 aggregate industries in the manufacturing industry.
3. Estimation results

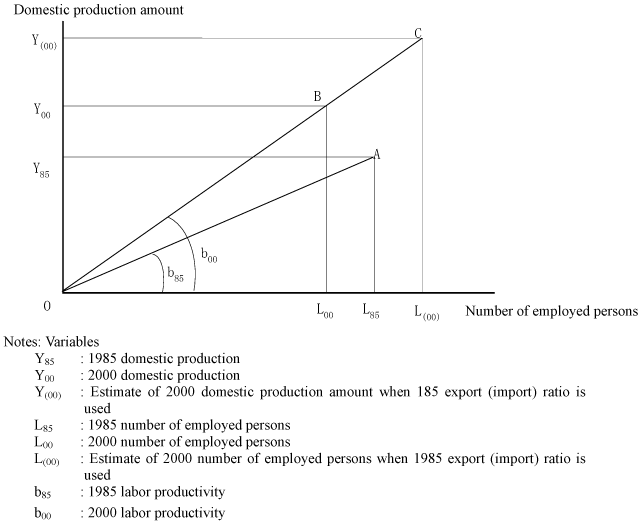
<Conceptual diagram>

The above conceptual diagram shows that output for 1985 (Y85) and its corresponding number of employed persons (L85) are represented by point A and that output for 2000 (Y00) and its corresponding number of employed persons (L00) are represented by point B.
Assuming that export and import ratios for 1985 remain unchanged from then onwards, output for 2000 (Y(00)) will be greater than actual output. Furthermore, point C represents the corresponding number of employed persons for Y(00) as L(00) since labor productivity increased from b85 to b00 in 2000.
The difference between L(00) and L00 represents the change in the number of employed persons due to the changes in the export and import ratios.
