Appended Note 2-3 Overview of the "Survey and Analysis of the Entrusted Organization under the Designated Management Entity System"
- Japanese
- English
1. Overview of the survey
In order to gain an understanding of the status of entrusted organizations under the Designated Management Entity System, the Cabinet Office appointed Nomura Research Institute, Ltd. in March 2005 to conduct a questionnaire survey for 942 businesses that are currently in operation and 519 businesses that were previously in operation that are operating and managing their facilities based on the Designated Management Entity System. In the end, responses were gained from 290 businesses currently in operation and 145 businesses previously in operation. The response rate was 31% for those currently in operation and 28% for those previously in operation.
In the questionnaire, the respondents were asked to choose one answer or write in their answer to questions regarding the form of organization (private corporation, NPO corporation, etc.), content of the contract (agreement), status on the operation, management of the facilities, details of the service(s) it provides, as well as self-evaluation on the above criterion, financial balance, and problems in the current system, among others.
It must be noted that this survey includes those PFI businesses, which operates and manages the facilities that are starting to provide services in addition to the designated managers. However, there were only a few PFI businesses, who responded (10 businesses) and only a few which were included in the estimate (eight organizations in the estimate for the function of service quality and four businesses in the estimate for the function for expenditures).
2. Attributes of the survey respondents
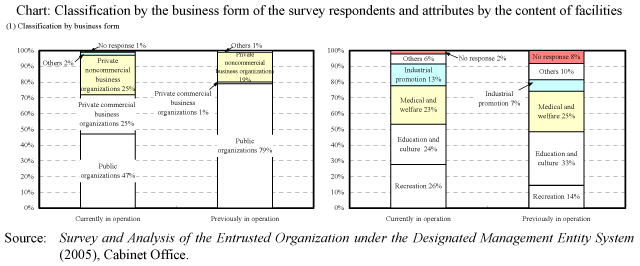
When taking a look at the attributes of the respondents to this survey, public businesses account for approximately half, or 47%, of all of those currently in operation. At the same time, private commercial business organizations and private noncommercial businesses account for approximately 25% each. As for those that were previously in operation, public businesses account for approximately 79% while private commercial businesses and private noncommercial businesses account for approximately 1% and 19% respectively. Next, when studying the content of facilities, each of the categories-recreation facilities, education and culture, and medical and welfare-for both those currently in operation and previously in operation-accounted for 20% to 30% of the whole.

3. Evaluation of the service quality with the "points rating evaluation approach"
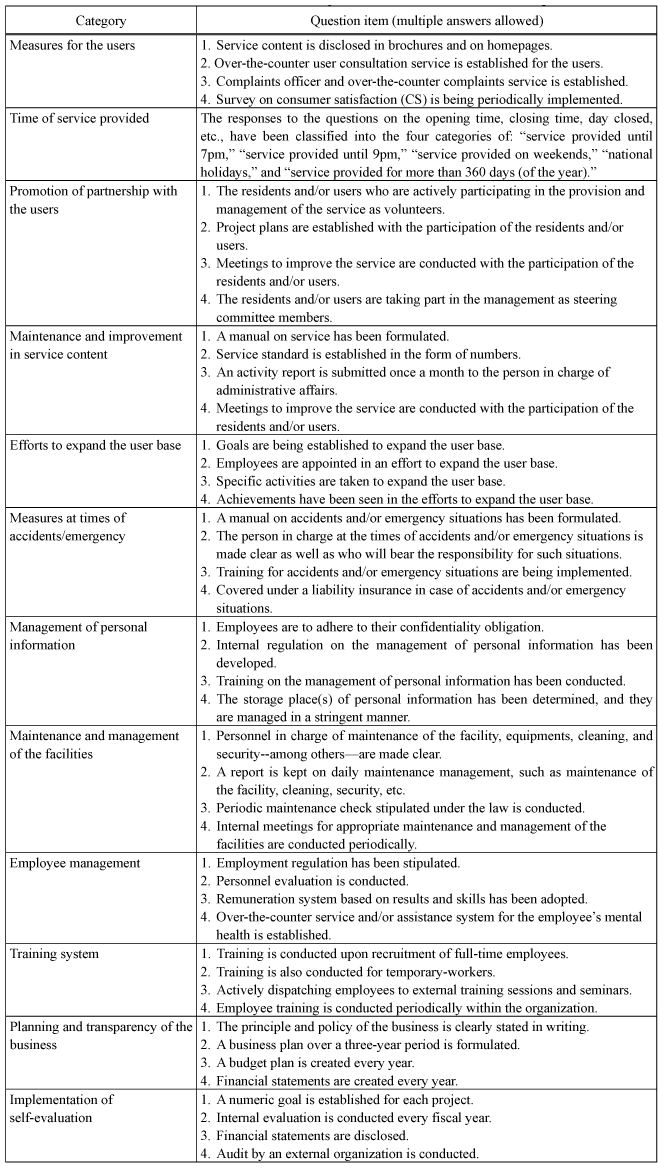
The points rating evaluation approach were used to evaluate the service quality from the results gathered from the questionnaire. In particular, the service quality was evaluated by the subtotal, which is a simple sum of the points for each evaluation item for service quality by category as provided in the chart below and the overall total which is a simple sum of the subtotals of the categories.

(Example calculation of the points)
Category: "Measures for the customers"
Select the best answer from the following five choices (multiple answers allowed).
- 1. Service content is disclosed in brochures and on homepages.
- 2. Over-the-counter user consultation service is established for the users.
- 3. Complaints officer and over-the-counter complaints service is established.
- 4. Survey on consumer satisfaction (CS) is being periodically implemented.
- 5. None of the above.
The point allocation is as follows: 0 point for 5, 1 point each for 1-4, giving a subtotal of 4 points for each category. The total sum of all categories is 48 points.
4.Estimation method of the function of service quality and the function for expenditures.
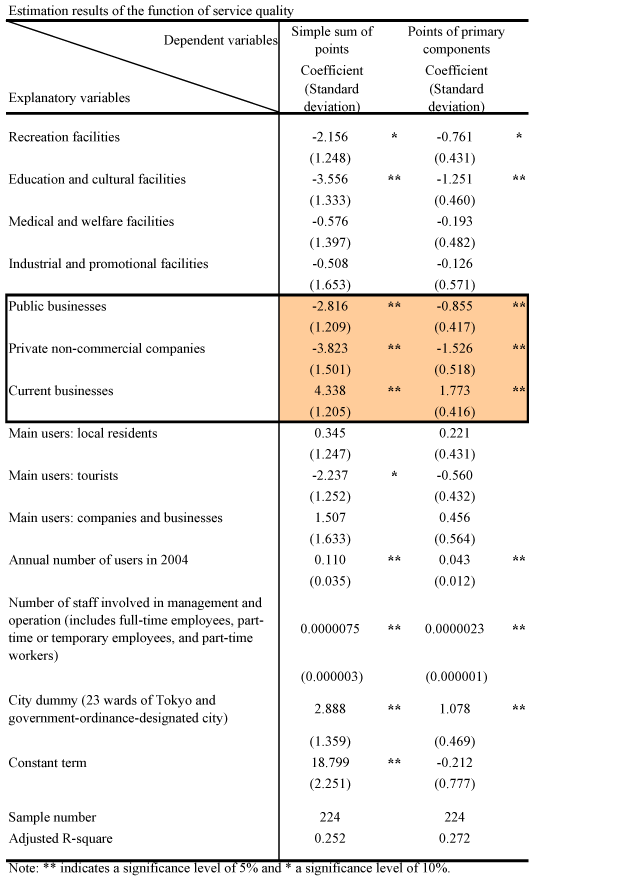
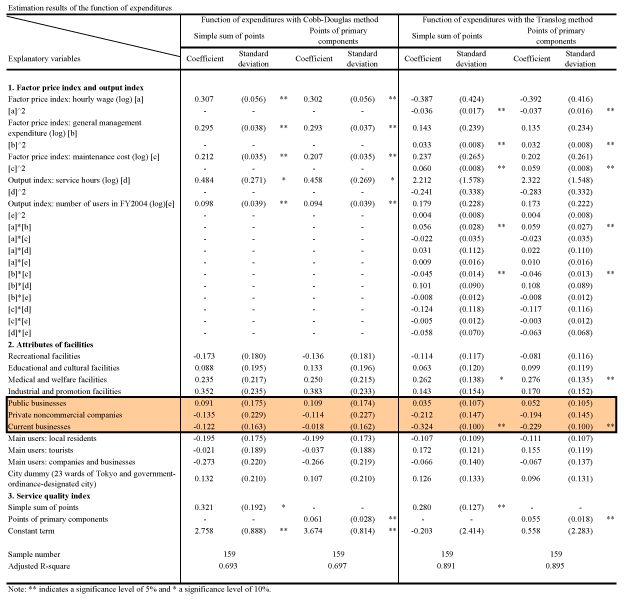
The function of service quality and that of expenditures were estimated to analyze the management efficiency from the perspective of service quality and expenditure.
The detailed estimation equation for the function of service quality is as follows:

Q, which is an included variable, is the number of points of each index and the total amount calculated through the simple point summation method. As for the explanatory variables, G represents the dummy variable for public businesses ("1"for public businesses and "0"for others), N the dummy variable for private non-commercial companies ("1"for private noncommercial companies and "0"for others), and A the dummy variable for current businesses ("1"for current businesses and "0"for others). Furthermore, X stands for the attributes of businesses (type of facilities, major users, number of staff, variable of city dummy) which is thought to have an impact on the services provided.  0 (constant term),
 ,
, ,
, ,
, are estimated parameters while
  represents the error term.
The following equation from the Translog function was applied for the estimation for the function of expenditures.

G represents the dummy variable for public businesses ("1"for public businesses and "0"for others), N the dummy variable for private non-commercial companies ("1"for private non-commercial companies and "0"for others), and A the dummy variable for current businesses ("1"for current businesses and "0"for others). Q is the quality of service measures in III, M for management expenditure, Y for service hours, and X for attributes of each business organization.  0 (constant term),
  ,
, ,
, ,
, ,
, 1,
1, 2,
2, 3,
3, 1,
1, 2,
2, ,
, are estimated parameters while
  represents the error term.


