Appended Note 2-2 Overview of the questionnaire survey on national contribution
- Japanese version
- English version
1. Conjoint analysis
A "conjoint analysis" was conducted as a method to assess people's preference for each of the items in the government spending, such as social security benefits and public services. The conjoint analysis formulates several alternative policy proposals by rearranging and combining individual attributes (i.e. content of spending, burden incurred from this) of the policy proposals to be assessed. People's preference by attribute is then assessed through asking people for their preferences. In general, this method is frequently used in marketing research, economics of traffic, environmental evaluation, and several other areas.
For this questionnaire survey, research was conducted based on the method shared below in order to gather data useful for a conjoint analysis. (FYI, a "choice-based" conjoint which asks the respondents to choose their answer from multiple choices was used in this research.)
2. Overview of the research
In order to research the people's preference on the size of government spending in the future and the potential national contribution rate, the Cabinet Office appointed the Shin Joho Center, Inc. in March 2005 to conduct a nationwide questionnaire survey targeting a total of 2000 males and females aged 20 to 69 in Japan. In the end, Shin Joho Center, Inc. received valid responses from 1118 people (55.9%).
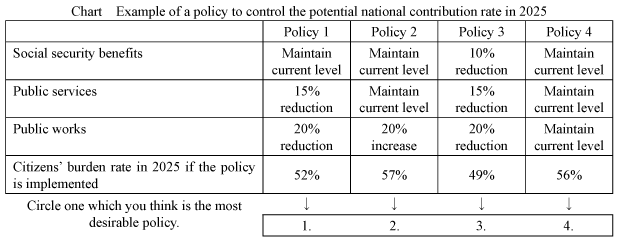
With regard to the questionnaire, thorough explanation was first given on the concept of the potential national contribution rate and the prospect on how much it will increase in the future. Then the respondents were asked to choose the most desirable policy proposal from the four choices provided in the chart shown below (Chart).
In particular, a basic scenario was postulated in which current policies are maintained, and the potential national contribution rate reaches 56% in 2025. Then, as counterproposals, policy proposals specifying various patterns of reductions or increases in the items of government spending were presented to the respondents.
For example, policy proposal 1 assumes that the potential national contribution rate in 2025 will be at 52% when the social security benefits are maintained at the current level, public works reduced by 15% and public services by 20%. Similarly, policy proposal 2 assumes that the potential national contribution rate in 2025 will be at 57% and policy proposal 3 at 49%. Policy proposal 4 assumes that the potential national contribution rate in 2025 will be at 56% when the social security benefits and public works are maintained at the current level. The respondents were asked to choose one answer from these four choices.
In order to gain statistically significant results, similar questions were repeatedly asked for eight patterns with different policy combinations (reduction rate of social security benefits and other items and the national contribution rate) in one questionnaire. Furthermore, six types of questionnaires, each with different policy proposal combinations, were prepared and distributed at random so as not to create any bias in the region, age, or other factors of the respondents.